Why Haven't You Heard of the All In One Loan™? A $700,000 Condo, Priced at the Worst Rate CMG Offers
A new video runs a $700,000 Oahu condo purchase through CMG's Interactive Comparison Simulator twice — a 30-year fixed at 7.375% against the All In One Loan™ priced at its highest margin, on purpose, as a worst case. The result: paid off in 11.2 years instead of 30, and $556,097.31 less interest. Here's every number, and the honest answer to the three questions people actually ask.
Why Haven't You Heard of the All In One Loan™? A $700,000 Condo, Priced at the Worst Rate CMG Offers
Last Updated: October 2026
If you've never heard of this loan, you're in good company — most people in the mortgage business haven't either. It's a proprietary CMG product, not something every lender can originate, which is the honest answer to the first question most people ask about it.
A new explainer video walks through it using one sample scenario — a $700,000 Oahu condo, 20% down — run twice through CMG's own Interactive Comparison Simulator: once as a standard 30-year fixed mortgage, once as the All In One Loan™, priced at the highest margin CMG offers. That second choice is deliberate. The video isn't showing you a best-case sales pitch; it's showing you the floor.
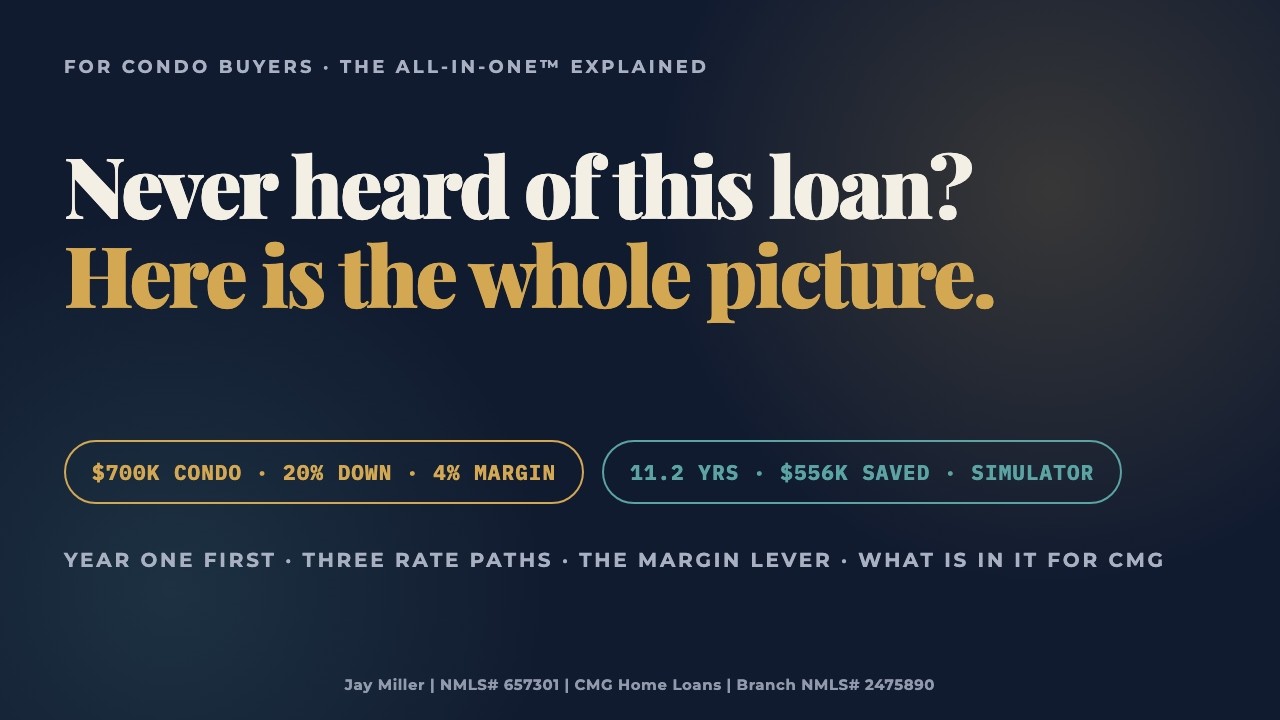
▶ Watch the full video on YouTube — then come back here for every number from it laid out in table form, with sourcing notes on which figures came from the simulator, which came from its CSV export, and which are arithmetic performed on the same inputs.
The Loan You Already Know
Start with the baseline, because the comparison only means something once you've seen what a traditional mortgage actually does in year one.
On a $560,000 loan (the amount financed on a $700,000 condo with 20% down, or $140,000) at a 30-year fixed rate of 7.375%, the first year looks like this:
| Year 1 | |
|---|---|
| Total paid | $46,413.36 |
| Of which, interest | $41,123.56 |
| Of which, principal | $5,289.80 |
Over the full 30-year term, that loan pays 148.6% of the original loan amount in interest alone — not a typo, not a worst-case assumption, just what a standard amortization schedule does when the first several years are almost entirely interest. This is the loan most Hawaii buyers already know. It's not a bad loan. It's just the only math engine most people have ever been shown.
Where This Idea Came From
The structure in the video isn't new, and it isn't exotic. Offset mortgages — pairing a mortgage with a checking account so idle deposits reduce the balance interest is calculated on — have been common outside the U.S. for decades. CMG has built and offered this structure domestically as a first-lien home equity line of credit with an integrated checking account since 2005. It's not a workaround or a hack on top of a normal mortgage; it's a different loan category entirely, in first-lien position on the title, replacing the mortgage rather than sitting behind it.
The Sample, Priced on Purpose at CMG's Worst Rate
Here's what went into the simulator run behind the video:
- Purchase price: $700,000 condo, 20% down ($140,000 down, $560,000 financed)
- Household income: $12,000/month in
- HOA dues, property taxes, and insurance: $800/month combined
- Living expenses: $4,932.22/month
- Left unspent: an estimated 20% of net income — roughly $2,400 a month — remains after all living expenses and the estimated housing payment, and stays in the account working against the balance
- Fixed-rate comparison: 7.375%
- All In One Loan™ rate: 7.746% — the 30-day average SOFR index at 3.746% plus a 4.000% margin
That 4.000% margin is the highest margin CMG offers on this product. It was chosen on purpose, as worst-case pricing, not because it's what every borrower gets. The margin on this product can be bought down with points at closing to as low as 2.500% — more on what that buys you later. The rate floats within a floor of 3.750% and a lifetime cap of 13.746%.
How the Balance Actually Moves
The mechanism is simple, even if it's unfamiliar: deposits lower the balance the day they land. Spending draws it back up as you use the account for everyday bills. Interest is calculated nightly on whatever the balance happens to be that day, and the prior month's total interest is drafted from the account once a month, around the 21st. In the first full month of the sample, that draft came to $3,542.81.
A Typical Month, Day by Day
December in the sample is a clean illustration of the pattern: the paycheck deposit drops the balance sharply, then the balance creeps back up day by day as ordinary expenses — groceries, utilities, the HOA payment — draw against the account. By December 31, the balance sits $2,724.97 lower than where the month started. That's arithmetic performed on the sample's own inputs, not a separate simulator run — the same "sawtooth" pattern repeats every month, and it's the entire mechanism driving everything below.
Year One, Side by Side
| All In One Loan™ | 30-Year Fixed | |
|---|---|---|
| Interest paid, year 1 | $40,113.73 | $41,123.56 |
| Principal retired, year 1 | $36,248 | $5,290 |
Even at worst-case pricing — a higher note rate than the fixed loan — the All In One Loan™ pays down roughly seven times as much principal in the first year, because every idle dollar in the account is working against the balance every night instead of sitting in a checking account waiting to be spent.
The Full Projection
This is the part that actually matters: not year one, but the full run.
| All In One Loan™ | 30-Year Fixed | |
|---|---|---|
| Balance, year 3 | $450,702 | $542,889 |
| Balance, year 5 | $364,122 | $529,195 |
| Balance, year 10 | $80,988 | $484,704 |
| Payoff | 11.2 years (134 payments) | 30 years (360 payments) |
| Total interest paid | $276,304.57 | $832,401.89 |
| Average minimum payment | $2,061.97 | $3,867.78 |
| Effective rate | 2.874% | 7.375% (note rate) |
The gap between the two totals is $556,097.31 in interest — on a loan priced at a higher sticker rate than the fixed mortgage it's being compared against. The "effective rate" of 2.874% isn't a different note rate; it's what 7.746% turns into once you account for how much of the balance is suppressed, night after night, by the sweep.
Equity You Can Actually Reach
Every dollar of that faster paydown stays liquid. At years 3, 5, and 10, the sample shows $109,000, $196,000, and $479,000 paid down — and because this is a revolving line, not a closed-end loan, all of it sits there as available credit, not equity you'd have to sell the condo or refinance to reach. Borrowers keep access to the line for the full 30-year term; the credit limit does begin stepping down incrementally after year 10, so if you're counting on that access deep into the loan's life, ask your lender exactly how that step-down schedule applies to your account.
The Rate, and 25 Years of the Index
The rate on this product resets monthly: 30-day average SOFR plus your fixed margin. CMG's own historical snapshot of that index, dated October 1, 2026, covers 25 years. Against that history, here's the breakeven: the index would need to sit at 7.997% — making the all-in rate 11.997% against this sample's 4.000% margin — before the All In One Loan™ stopped beating the fixed loan on total interest. That level is above anything the index has shown in 25 years of history. It doesn't mean it can't happen; it means the margin for error, at this worst-case pricing, is considerably wider than the sticker-rate comparison suggests.
Three Paths for the Next Decade (Not Forecasts)
None of this is a prediction. These are three what-if paths, modeled with a daily calculation calibrated to within one payment of the simulator's own output, holding the 4.000% margin fixed and varying only where the index goes from here:
| Path | Payoff | Total interest |
|---|---|---|
| Index tracks its historical average | 10.1 years | ≈$200,000 |
| Index follows a typical rate cycle | 10.9 years | ≈$254,000 |
| Worst case: index returns to its 25-year high and stays there | 12.4 years | ≈$371,000 |
Even in that worst case — the index sitting at a level it has only touched briefly in 25 years, and staying there for the life of the loan — the total interest is still roughly $461,000 less than the fixed loan's $832,401.89. The cap (13.746%) is the hard ceiling past which the rate cannot rise further, no matter what the index does.
The Margin Lever
The 4.000% margin used throughout this example is the one CMG uses for worst-case pricing — not the only margin available. The margin can be bought down with points paid at closing, down to 2.500%. Modeled at that lower margin, the same sample pays off in roughly 10.0 years with roughly $194,000 in total interest — meaningfully better than the worst-case numbers above, using the same income, same spending, same purchase. The margin you actually qualify for and choose to buy down is a conversation with your loan officer, not a number this article can set for you.
The Three Questions, Answered
Why haven't I heard of this? Because it's a proprietary CMG product. Not every lender offers it, and loan officers who don't offer it generally don't bring it up — not out of concealment, just because it isn't in their product shelf.
What's in it for the lender? CMG is paid the same way any lender is paid on a line of credit: interest on the outstanding nightly balance, at the index plus the margin.
Is this too good to be true? Start with the fair objection. The comparison above lets the fixed-loan household's roughly $2,400 monthly surplus sit idle. A household that sent every one of those dollars to extra principal on a fixed loan, especially at a lower fixed rate, could match this payoff and likely pay somewhat less interest, depending on where rates go over the life of the loan. The simulator comparison doesn't model that, and you should know it.
What that version of the math leaves out is what it takes to actually do it, and what you give up along the way:
- The money you pay down stays reachable. Extra principal on a fixed loan is gone until you sell or borrow again, through a cash-out refinance or a separate HELOC, each with its own application and costs. On the All In One Loan™, everything you pay down stays available as credit on the same line, with no new loan.
- Lower rates arrive without a refinance. A fixed-loan borrower who wants a lower rate has to refinance: thousands of dollars in closing costs, and often a fresh 30-year clock or a new term picked to match where the payoff already stands. The All In One Loan™ rate follows the index every month. That works in both directions, which is the risk covered above.
- It doesn't depend on willpower. Matching this payoff on a fixed loan means writing a large extra check every month for 130 to 170 months straight. In my experience, plenty of borrowers add a couple hundred dollars here and there; far fewer send every spare dollar, every month, for more than a decade. On the All In One Loan™ the paydown happens because your pay lands in the account and your bills go out of it. You earn and spend the way you already do.
There are households for whom a fixed loan plus disciplined extra payments is the better answer, especially when fixed rates are much lower than they are today. With 30-year fixed rates in the low-to-mid 7% range, though, a household with a steady surplus should model the All In One Loan™ side by side with a fixed loan before choosing. Whether it's right for yours is still a real question, covered next.
Who This Fits (and Who It Doesn't)
Everything above depends on one ingredient: a genuine, steady monthly surplus running through the account. The larger and more reliable that surplus, the larger the effect. It fits dual-income households with real monthly cash flow left over after expenses, and it does not fit households living paycheck to paycheck, or anyone who would treat open access to the balance as spending money rather than parked savings. For the fuller breakdown of who should and shouldn't consider this structure, see First-Lien HELOCs vs. Traditional Mortgages.
How These Numbers Were Produced
Transparency on sourcing matters more than usual on a loan this unfamiliar, so here's exactly where every figure above came from:
- Quoted directly from CMG's Interactive Comparison Simulator: payoff timeline, total interest paid, the average minimum payment, the effective rate, and the breakeven rate.
- From the simulator's CSV export: year-one interest, the monthly draft amounts, and the loan balances at the year 3/5/10 marks.
- Arithmetic performed on the same inputs — not separate simulator runs, and not forecasts: the day-level December example, the three what-if rate paths, and the 2.500%-margin figures.
- The 25-year index chart: CMG's own historical snapshot, dated October 1, 2026, with reference lines added.
Simulator key code Bzz-Rcc-Eyf (saved October 18, 2026). Enter it at allinoneloan.com to change any input to your own numbers — income, expenses, purchase price, down payment, margin — and see your own comparison, not this article's.
Assumptions and Disclosures
Both rates were held flat for the simulator run shown here (All In One Loan™ at 7.746%, fixed at 7.375%), and deposits and spending were held steady throughout — this is a snapshot of one set of inputs, not a projection of where rates or your own finances will actually go. The All In One Loan™ is a variable-rate, first-lien home equity line of credit tied to 30-day average SOFR plus a fixed margin, with a floor of 3.750% and a lifetime cap of 13.746%; margins from 2.500% to 4.000% are bought down with points paid at closing. Rates and terms are subject to change and to credit approval. Borrowers keep access to the line for the full 30-year term; the credit limit begins to step down incrementally after year 10.
The Bottom Line
The sales version of this story would have run the comparison at the cheapest margin CMG offers and called it a day. This video, and this article, didn't do that — it ran the worst margin on purpose, held both rates flat, showed the breakeven point against 25 years of index history, and handed over the key to check the math yourself. At that worst-case pricing, the sample household still paid off the condo in 11.2 years instead of 30, and kept $556,097.31 that the fixed loan would have paid in interest.
That doesn't make it the right loan for every household — it depends entirely on having a real, steady monthly surplus and the discipline to run your banking through the account. But it does make the first question — why haven't I heard of this? — worth asking your own lender directly.
Want your own numbers run the same way, at your own purchase price and margin? Reach out anytime at (808) 429-0811 or jaym@cmghomeloans.com, or get pre-approved with Jay Miller →
Frequently Asked Questions
What is CMG's Interactive Comparison Simulator? It's the tool CMG uses to run a side-by-side comparison between the All In One Loan™ and a traditional mortgage using a household's actual income, expenses, purchase price, and rate inputs. The simulator key code in this article (Bzz-Rcc-Eyf) lets you reload this exact scenario at allinoneloan.com and change any input to see your own numbers.
Why did the video use CMG's highest margin instead of a lower one? To show the floor, not the ceiling. A 4.000% margin is worst-case pricing for this product — if the math still works out favorably there, it only improves with a lower, bought-down margin. The margin lever section above shows the same scenario at 2.500%.
Is the All In One Loan's rate ever fixed? No — it's a variable rate, 30-day average SOFR plus a fixed margin, resetting monthly within a floor (3.750% in this example) and a lifetime cap (13.746% in this example). The margin itself is fixed for the life of the loan once you choose it; only the index component moves.
What happens if the index rises sharply and stays there? The "three paths" section above models exactly that: even if the index returns to its 25-year high and stays there for the life of the loan, this sample still pays roughly $461,000 less in total interest than the fixed-rate alternative — though the payoff timeline stretches from 11.2 years to about 12.4 years. The lifetime cap (13.746%) is the hard limit past which the rate cannot climb further.
Does this example apply to my situation? No two households have the same income, spending, or purchase price, and the entire structure depends on having a genuine, steady monthly surplus. Use the simulator key to load this scenario and then change the inputs to your own numbers — that comparison, not this one, is the one that should inform your decision.
Couldn't I get the same result by paying extra on a fixed-rate loan? Possibly, if you send your entire monthly surplus to principal every month for more than a decade, and especially if your fixed rate is low. The trade-offs: money paid into a fixed loan can't be reached again without selling or taking out a new loan, a lower rate later requires a paid refinance, and the result depends on making a large extra payment every month rather than happening automatically as you earn and spend.
Who should not consider this loan? Households without consistent positive monthly cash flow, anyone who would treat open credit access as spending money, and borrowers who need the absolute payment certainty of a fixed rate regardless of the math. See First-Lien HELOCs vs. Traditional Mortgages for the fuller breakdown.
Related Articles
- First-Lien HELOCs vs. Traditional Mortgages: Why the Interest Rate Isn't the Number That Matters
- The All In One Loan™ in Hawaii: how it works and who it fits
- When and How to Refinance Your Hawaii Mortgage
- Understanding Closing Costs in Hawaii
Published by Jay Miller, CMA | NMLS #657301 | CMG Home Loans, Honolulu, Hawaii | RealityCents.com